
How LiDAR measures the toll of climate disasters
Comparing LiDAR data from before and after the January 2025 fires in Los Angeles reveals the scale of devastation in ways satellite imagery can’t match.

Updated Aug. 26, 2025.
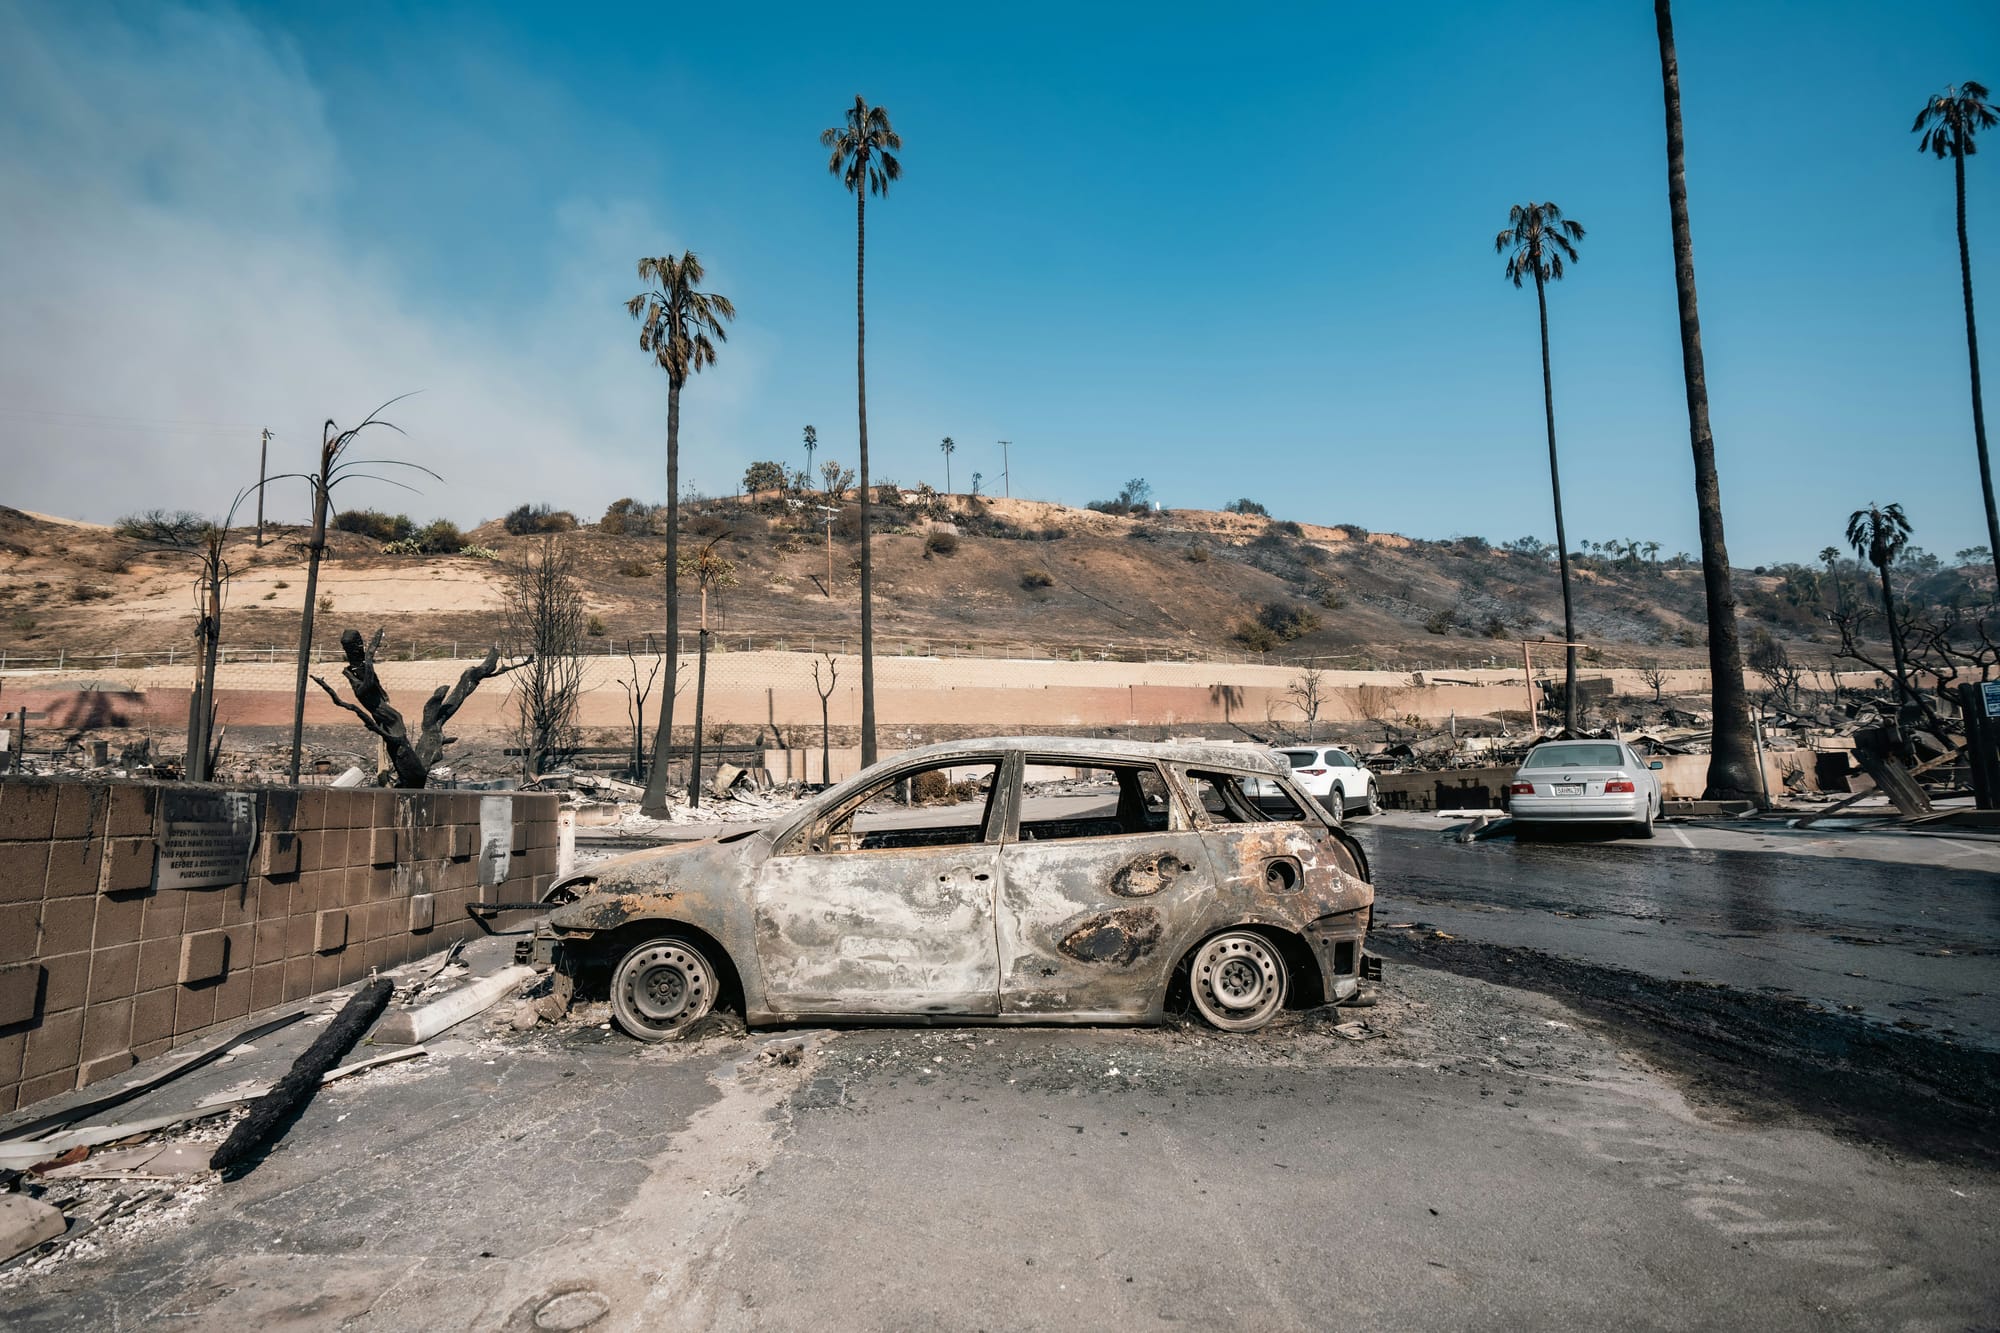
The wildfires that swept through Los Angeles County in January 2025 left an indelible mark on the Southern California landscape. The Eaton and Palisades fires raged for 24 days, killing 29 people and destroying 16,000 structures, with losses estimated at $60 billion. More than 55,000 acres were consumed, and the landscape itself was physically transformed.
Researchers are now using LiDAR (light detection and ranging) technology to precisely measure these changes in the landscape’s geometry—helping them understand the effects of climate disasters.
LiDAR, which measures how long it takes for pulses of laser light to bounce off surfaces and return, has been used in topographic mapping since the 1971 Apollo 15 mission, which used an early LiDAR system to scan the Moon’s surface.
Today, in addition to mapping complex urban landscapes for autonomous vehicles, airborne LiDAR collection from planes and drones capture snapshots of the Earth’s surface geometry. Scientists can then "diff" the data—compare before-and-after snapshots and highlight all the changes—to identify more subtle consequences of a disaster, including fault line shifts, volcanic eruptions, and mudslides.
Falko Kuester, an engineering professor at the University of California, San Diego, co-directs ALERTCalifornia, a public safety program that uses real-time remote sensing to help detect wildfires. Kuester says LiDAR snapshots can tell a story over time.
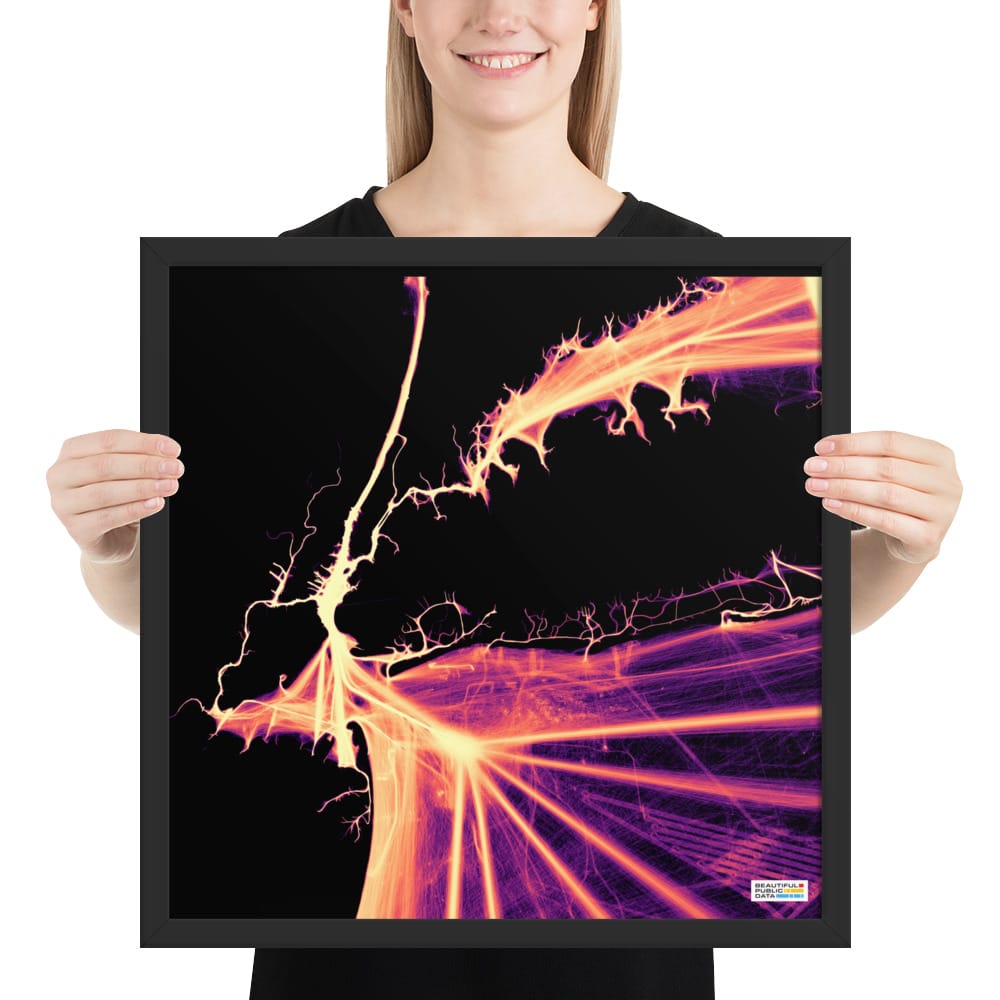
🚢 AIS Ship Movements Framed Prints
Ships at sea are constantly broadcasting their real-time location, identification, speed, and orientation data via AIS. Plotting out a year's worth of ship movements reveals beautiful patterns of our journeys at sea. Ferries, fishing boats, cargo ships and sailboats' coordinates etch electric pathways in these stunning visualizations of NOAA data.
🖼️ Prints featuring: NYC, Hilton Head SC, Baltimore / DelMarVa, Gulf of Mexico, Florida, Chicago, Southern California, Seattle/Tacoma/San Juan Islands, Cape Cod/Martha's Vineyard/Nantucket
“They give us a lay of the land,” he says. “This is what a particular region has been like at this point in time. Now, if you have consecutive flights at a later time, you can do a ‘difference.’ Show me what it looked like. Show me what it looks like. Tell me what changed. Was something constructed? Something burned down? Did something fall down? Did vegetation grow?”
Shortly after the fires were contained in late January 2025, ALERTCalifornia sponsored new LiDAR flights over the Eaton and Palisades burn areas. NV5, an inspection and engineering firm, conducted the scans, and the US Geological Survey is now hosting the public data sets.
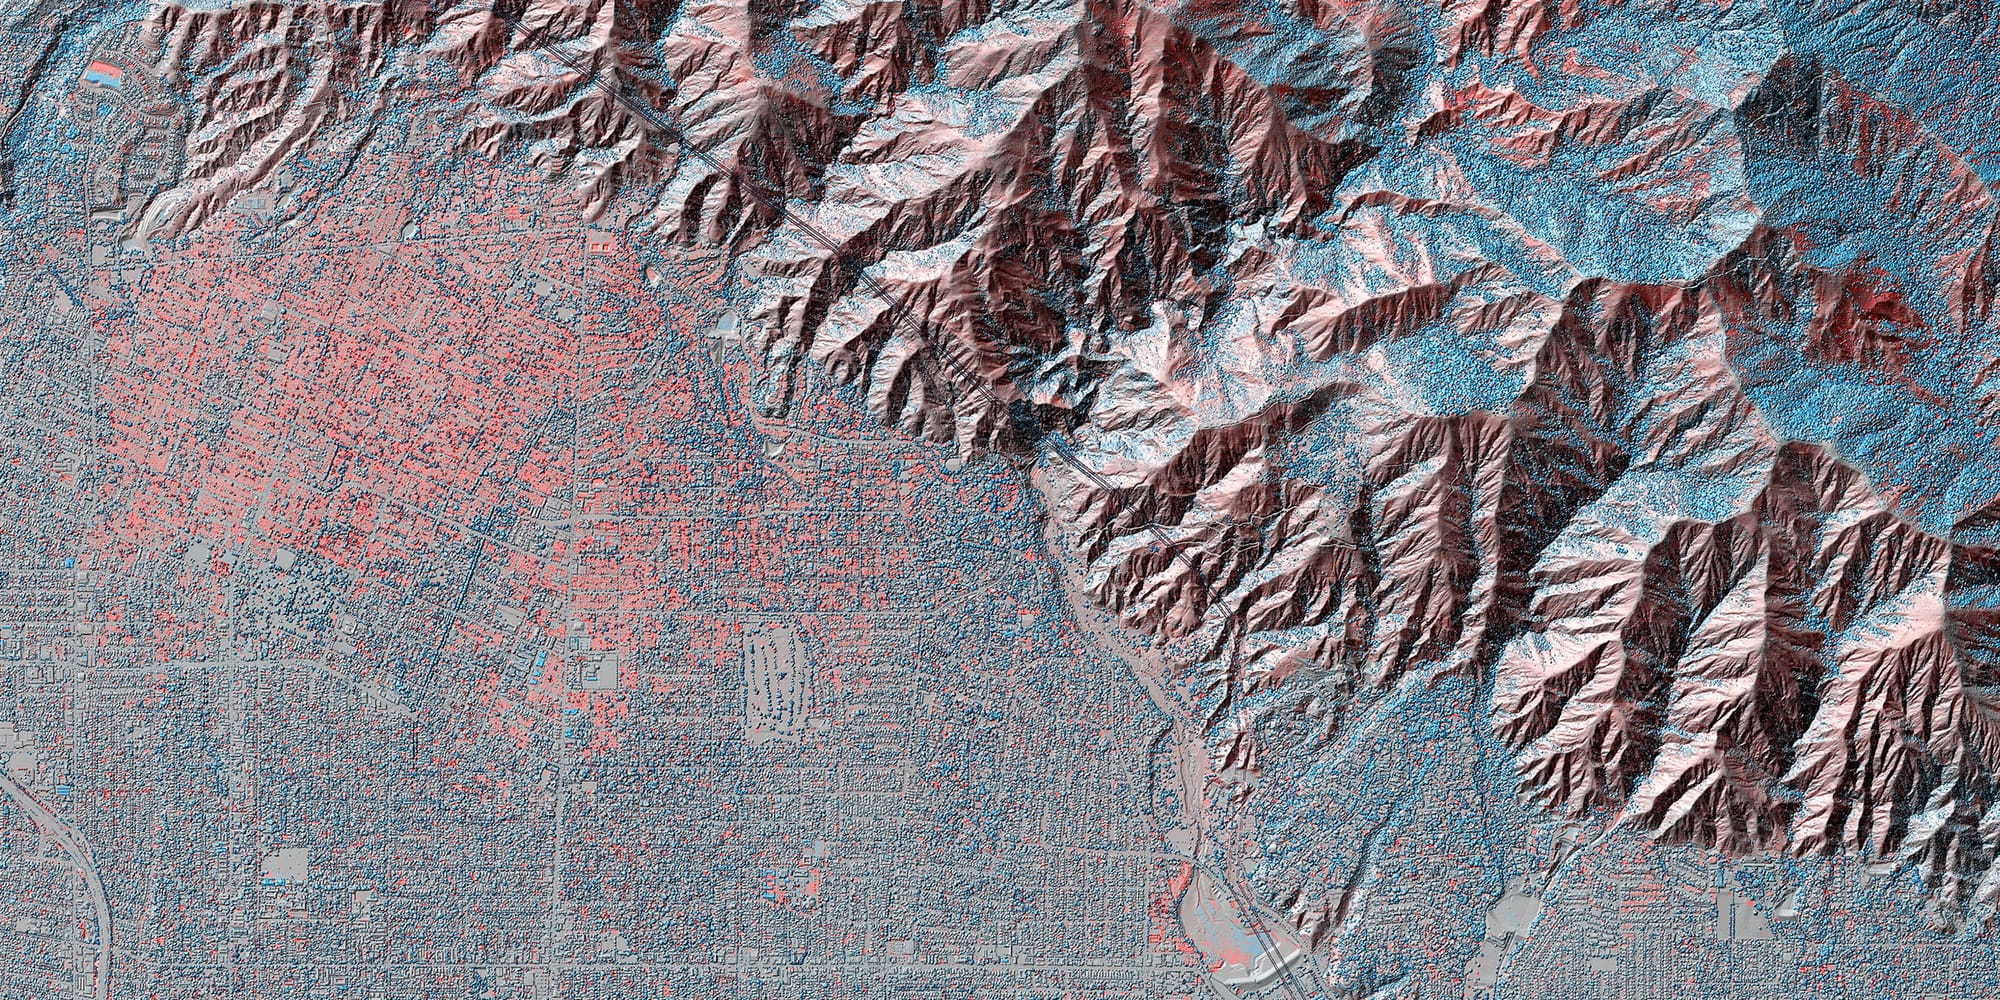
Comparing a 2016 LiDAR snapshot and the January 2025 snapshot, Cassandra Brigham and her team at Arizona State University visualized the elevation changes—revealing the buildings, trees, and structures that had disappeared.
“We said, what would be a useful product for people to have as quickly as possible, since we’re doing this a couple weeks after the end of the fires? And we thought trying to get as high of a resolution and as kind of as differencing as possible would be a good idea,” said Brigham. Her team cleaned and reformatted the older, lower-resolution data and then subtracted the newer data. The resulting visualizations reveal the scale of devastation in ways satellite imagery can’t match. Red shows lost elevation (like when a building burns), and blue shows a gain (such as tree growth or new construction).
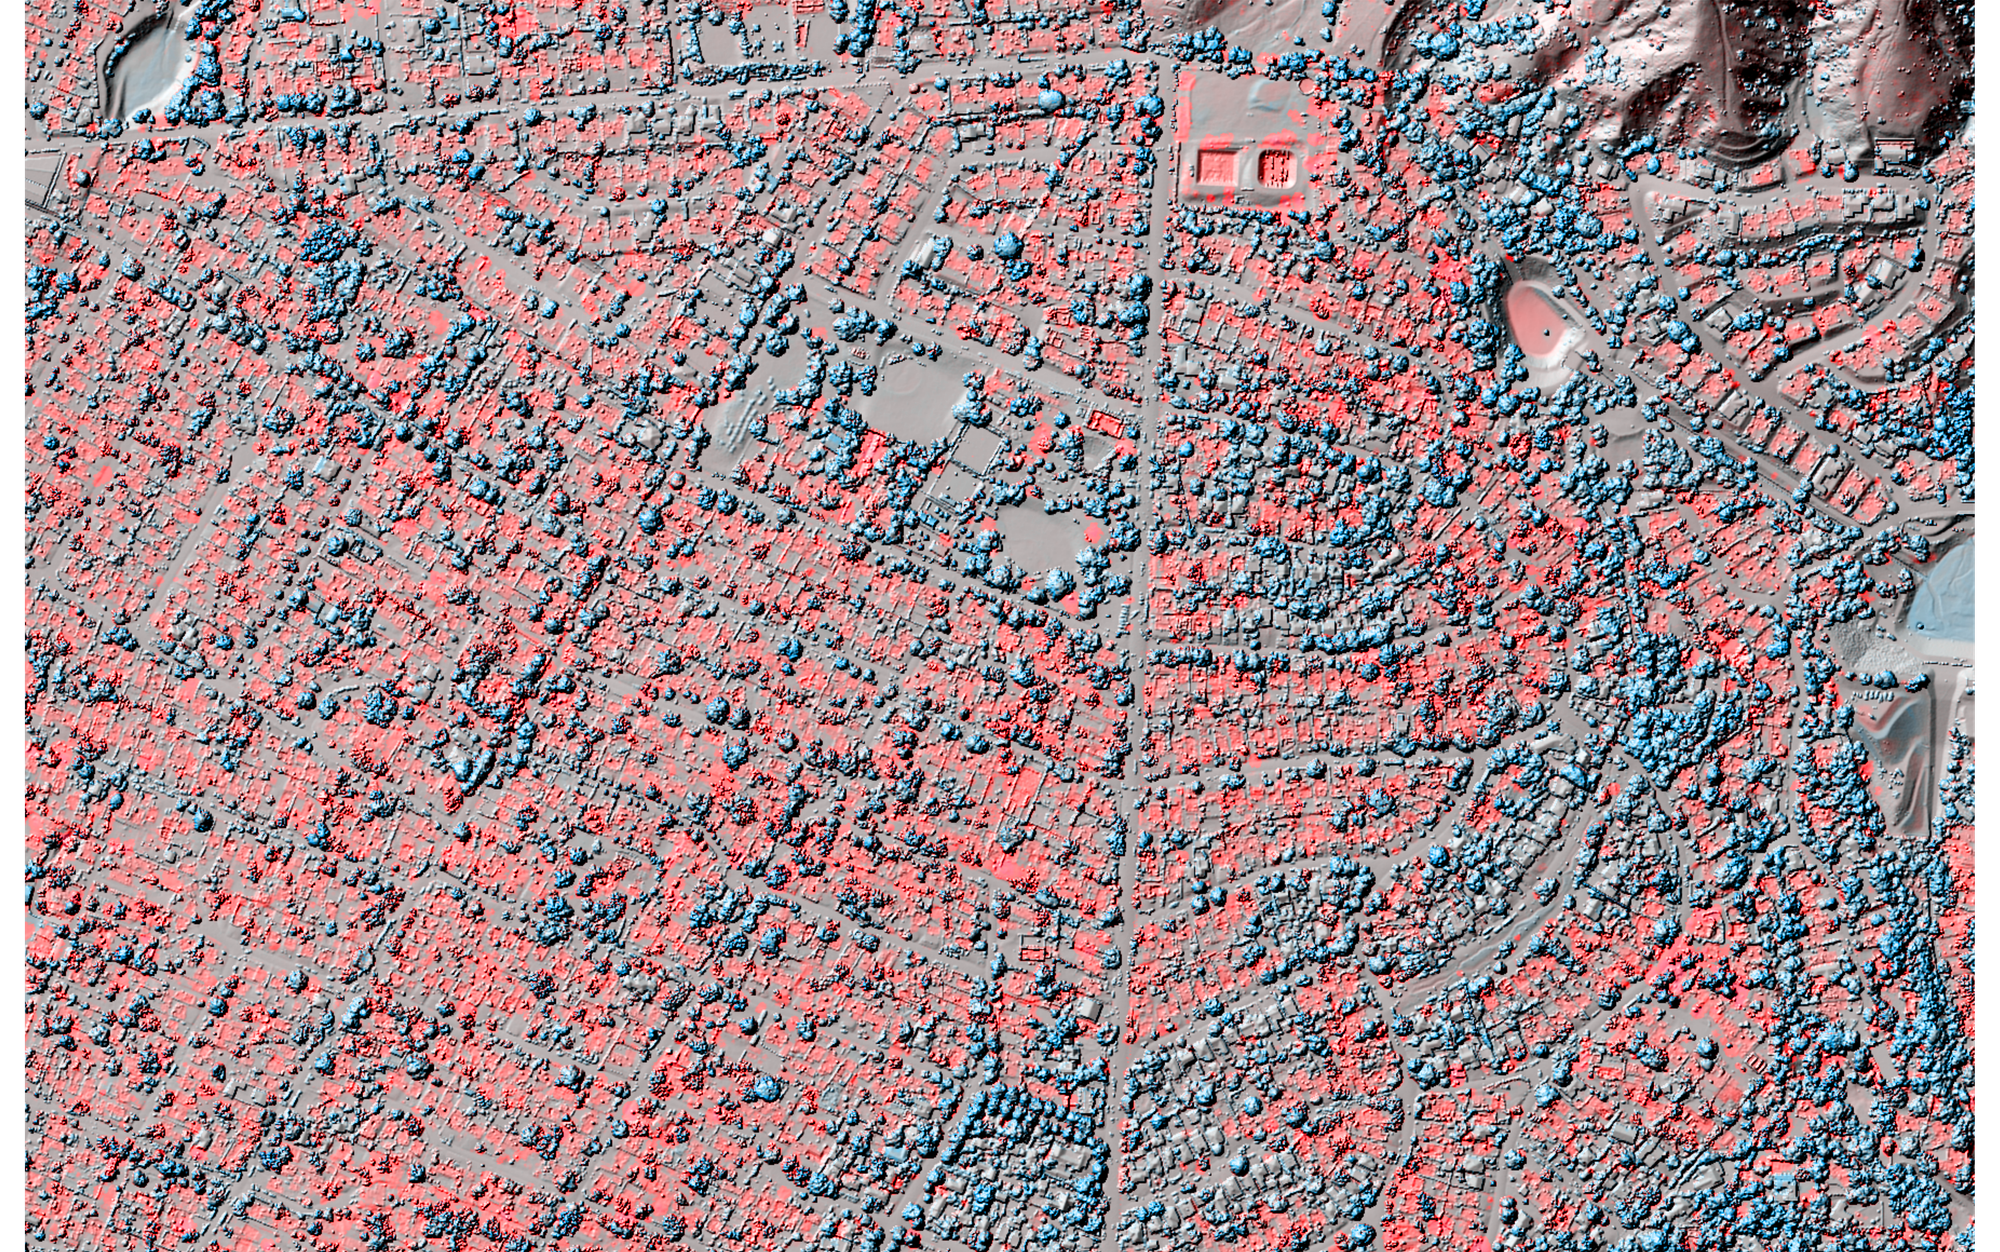
Historical LiDAR captures are sparse early on, but they're becoming more frequent. “Maybe there’s one from 1990, then 2004, then you get 2015 and then you start getting closer and closer data sets,” said Brigham. The ASU team shared their analysis and data on OpenTopography, a clearinghouse for open topographic data, tools and tutorials. The resulting visualizations reveal the scale of devastation in ways satellite imagery can’t match.
LiDAR is helping scientists track the cascading effects of climate-driven disasters—from the damage to structures and vegetation destroyed by wildfires to the landslides and debris flows that often follow in their wake.
“For the Eaton and Palisades fires, for example, entire hillsides burned. So all of that vegetation is removed,” Kuester says. “Now you have an atmospheric river coming in, dumping water. What happens next? You have debris flows, mud flows, landslides.”
Brigham also noted how the immediate aftermath of a burned landscape can offer important clues about flood risk from hillsides that have been stripped of vegetation. “The dry rabble that you saw happening immediately post-fire, tells you a lot about what happens in terms of debris flows that are going to happen a lot later,” said Brigham.
“It's subtle in the LA data set, but you'll notice areas where sediment is coming off of the hill slopes and gathering into the channels. And so you're building up these sediment dams that will then kind of flow in the next rainfall.”
LiDAR’s usefulness for quantifying the costs of climate disasters underscores its value in preparing for future fires, floods, and earthquakes. But as policymakers weigh steep budget cuts to scientific research, these crucial LiDAR data collection projects could face an uncertain future.
Aug. 26, 2025 - Corrected a quote from Cassandra Brigham.
A version of this story was originally published in MIT Technology Review.
For this post, I downloaded LiDAR datasets from the USGS and loaded them into QGIS. This article from OpenTopography detailing the analysis of the data set written by Cassandra Brigham, Chelsea Scott, and Christopher Crosby was very helpful!
The slider is from Flourish.
You can subscribe to our newsletter to get future posts delivered to your inbox for free. 👉🏻 📫 Subscribe now.
☕️ Buy me a coffee
Say thanks with a one time tip.
Sharing is caring
📣 If you think your friends may like it, please consider sharing it.
👕🖼️ Buy Beautiful Public Data merch on our Etsy shop
Unique t-shirts and prints inspired by our stories.
🙋🏻♀️ If you have any suggestions, comments or requests, please email them to beautifulpublicdata@gmail.com
Thanks for reading!
- Jon Keegan
Bluesky: @jonkeegan.com
Mastodon: mastodon.social/@jonkeegan