
The GOES-16 Weather Satellite
Satellites used to observe weather are so ubiquitous it is easy to take them for granted. GOES-16 is worthy of your attention.

A loop I made of of ~5 days from imagery from GOES-16 (GeoColor).
Satellite images used to observe weather are so ubiquitous it is easy to take them for granted. Incredibly detailed, near-real-time imagery for any inch of the Earth can be pulled up in seconds on your phone or computer and they have been in the background behind meteorologists forecasting the weather on television for decades.
But there is one extraordinary weather satellite that is worthy of your attention. It sits locked in a geostationary orbit 22,300 miles from Earth, and it points directly at the Western Hemisphere, eye level with the equator. It can see in sixteen wavelengths, detect lightning strikes and is used to monitor wildfires, hurricanes, supercell thunderstorms, dust storms, snow, sea temperatures and every cloud you can imagine. This satellite's name is GOES-16.
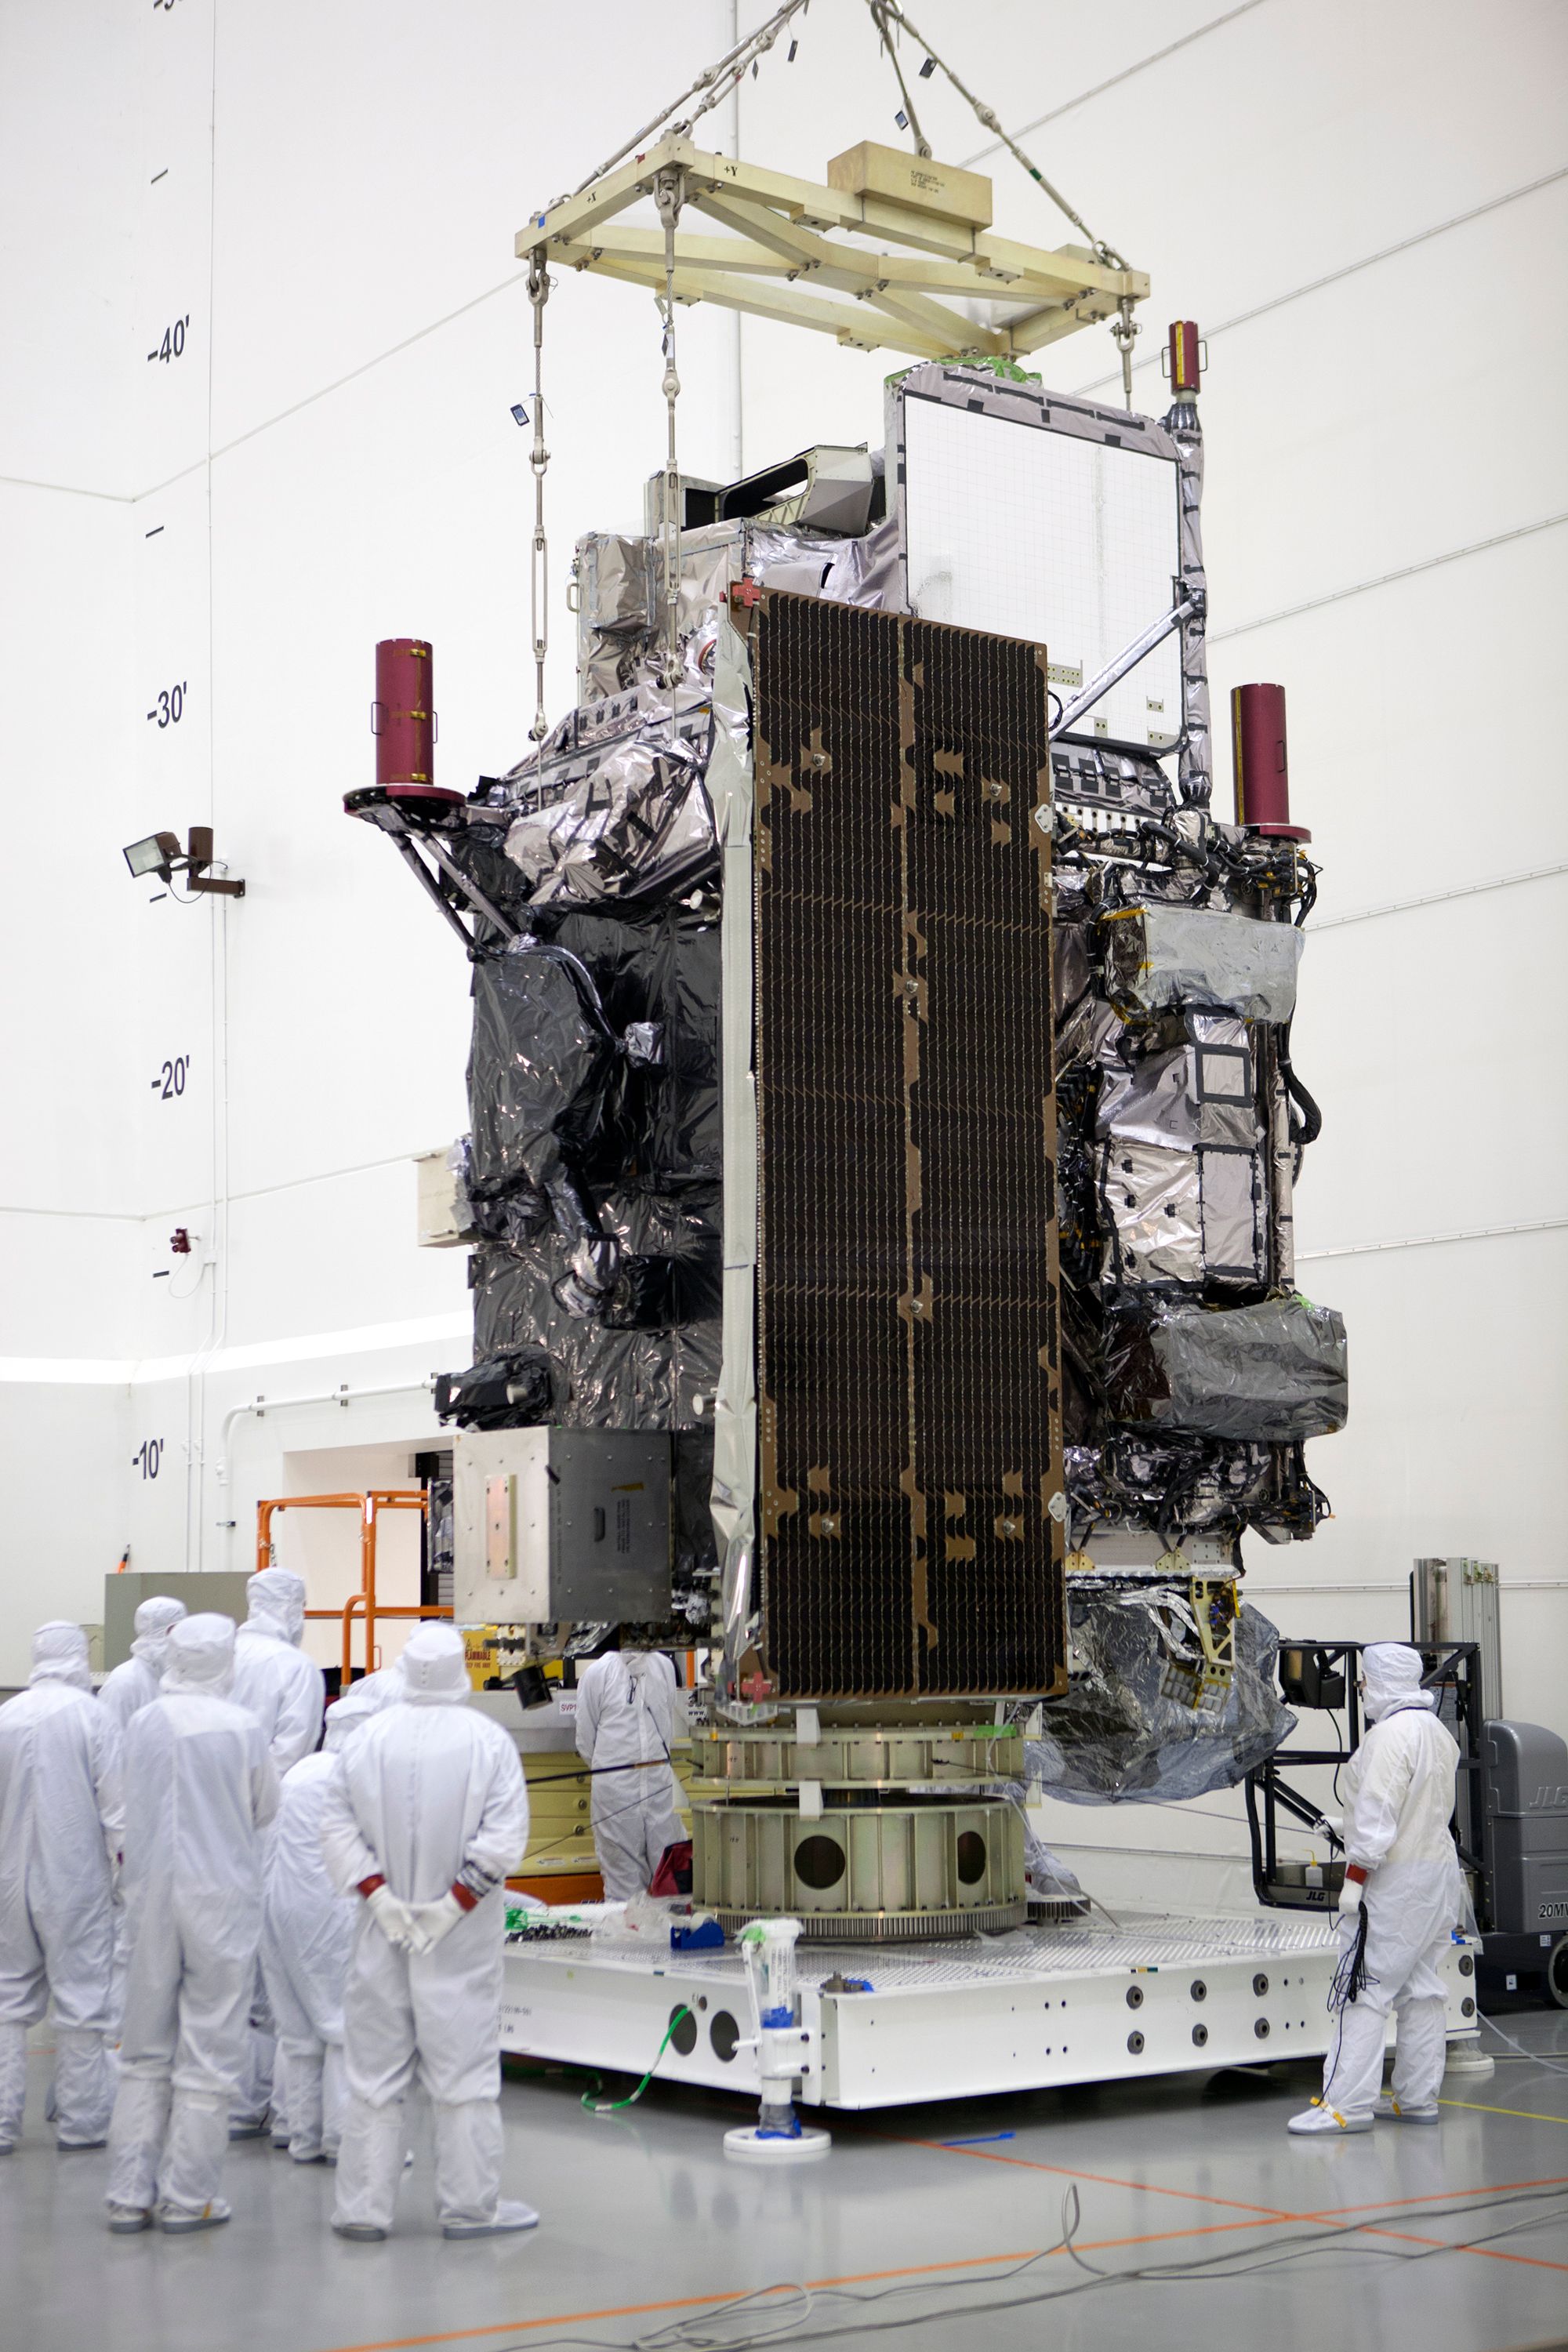
Launched on November 19, 2016 from Cape Canaveral, Florida on a ULA Atlas V rocket, GOES-16 was the first of four geostationary weather satellites in its class (GOES-R).
GOES-17 (launched in 2018, which was photographed by GOES-16) is the twin satellite with the same instruments that is positioned farther west, above the Pacific ocean. And GOES-18 was just launched in Mach of 2022, but is still being calibrated before being sent to its main position. While these are both equally great satellites (really!), I’m focusing here on GOES-16, as it has the perfect view of the prime landmasses of the Western Hemisphere.
These satellites’ main camera (the Advanced Baseline Imager) can see in 16 different spectral bands, optimized for different purposes such as analyzing vegetation, heat, snow, smoke, volcanic ash, dust, fog, clouds and water in addition to sea, land and air temperature.
GOES-16 was also the first satellite to launch with a “lightning mapper” sensor, which is tuned to the specific color range of lightning. This sensor makes possible time lapse videos of big storms that are crackling with lightning strikes as the clouds boil and churn, and they are truly beautiful displays of violent weather events.
March 22, 2022. "Tornadic storms trek through Texas - GOES-16 visible (band 2) + GLM group energy density" (CIRA Loop of the Day). Source: Cooperative Institute for Research in the Atmosphere at Colorado State and the National Oceanic and Atmospheric Administration (CIRA/CSU & NOAA)
These satellites also have sun-facing sensors that are worthy of a whole post of their own. In addition to being able to monitor Earth’s weather in incredible detail, GOES-16 can also monitor the “weather” in space, with specialized instruments to detect solar storms and monitor changes to the Earth’s magnetic field.
Processing and curating
I spoke with Dakota Smith (@weatherdak), who is a satellite analyst and communicator at the Cooperative Institute for Research in the Atmosphere (CIRA) at Colorado State. Dakota has the fun job of looking through the firehose of GOES-16 and 17 satellite imagery to find the most interesting or newsworthy imagery to share with the public through social media.
CIRA collects and processes all of the satellite imagery in partnership with NOAA.
One of CIRA’s most notable contributions to this processing is the “GeoColor” imagery product, which strives for an accurate true color view of the Earth (when sowing the Earth at night, GeoColor highlights the clouds in blue, and overlays a representative layer of city lights for reference).
Most satellite images you see aren’t just a static image that comes directly from the hardware. In fact, most are composites – you could think of them as recipes – that merge and overlay images focused on different slices of the spectrum, based on the thing you are seeking to highlight.
May 2, 2022 - "Dust storm charges south from Colorado Plains as wildfires burn in New Mexico - GOES-16 GeoColor" - (CIRA Loop of the Day). Source: Cooperative Institute for Research in the Atmosphere at Colorado State and the National Oceanic and Atmospheric Administration (CIRA/CSU & NOAA)
For example, if you were interested in studying deforestation in the Amazon, you might want to hone in on the green light reflected by vegetation. But if you were looking at wildfires in California, you might want to highlight the distinct reflections of heavy smoke, and also emphasize the heat signatures of the fires themselves.
But when making these recipes for satellite images, color can be used to emphasize – or perhaps even exaggerate – what the sensor can actually detect in order to clearly communicate the conditions being observed.
“The fire temperature product is sort of aesthetically pleasing to look at…it really shows you where the fire is in way that makes sense. It's bright red, it's like what you would expect the fire to look like, even though you're not seeing the fire itself, you're seeing a visualization of the hot spot”, said Smith.
September 7, 2021. "Hurricane Larry's large eye churns - GOES-16 visible (band 2)". - (CIRA Loop of the Day) Source: Cooperative Institute for Research in the Atmosphere at Colorado State and the National Oceanic and Atmospheric Administration (CIRA/CSU & NOAA)
The same is true of the lightning mapper. Referring to the blueish-purple sparkles that the sensor detects, Smith said “It's not what you'd see with the naked eye, but rather a product based on lightning strikes. So I think that lays the foundation for all of it.”
GOES-16's Greatest Hits
The most popular imagery that Smith has published was a loop showing an ominous swirling Hurricane Dorian with a crisp eye that is crackling with lightning strikes as it barreled towards Florida’s east coast.
My favorite satellite loop of the year and maybe even the decade.
— Dakota Smith (@weatherdak) December 23, 2019
Lightning within the beast that was Hurricane Dorian. pic.twitter.com/I1e2oTI2xK
Smith also loves sharing exotic cloud movements such as von Kaman vortices, "actinoform" clouds and gravity waves.
Rounding out this "best of the decade" satellite thread...
— Dakota Smith (@weatherdak) December 31, 2019
We got so many awesome, new looks at von Karman vortices. pic.twitter.com/sC74pe1GPX
This one with gravity waves traveling over top, is one of my favorites. pic.twitter.com/q1wA5JyH8a
— Dakota Smith (@weatherdak) December 31, 2019
As I write this post, Hurricane Ian is barreling towards Florida and looks to be a dangerous storm. Here's what it looks like in the infrared band:
Hurricane Ian in Infrared from GOES-16 on Sept. 26, 2022. Source: CIRA/NOAA Cooperative Institute for Research in the Atmosphere at Colorado State and the National Oceanic and Atmospheric Administration (CIRA/CSU & NOAA)
There’s no shortage of awe-inspiring natural and weather phenomena to share with the public – but it is always sobering to note that while many of these weather events look visually incredible from the vantage point of a remote camera in space, increasingly they are resulting in deadly consequences for the humans experiencing them back on Earth.
If you are like me, and could stare at this mesmerizing footage for hours, I have good news for you! I made a supercut of all the archived "Loop of the Day" videos that CIRA which clocks in at just over two hours, which you can view here.
A two-hour long supercut I made of CIRA/NOAA's "Loop of the Day" movies showing the most interesting footage from GOES-16/17/18. Source: Cooperative Institute for Research in the Atmosphere at Colorado State and the National Oceanic and Atmospheric Administration (CIRA/CSU & NOAA)
Working with this processed GOES-16 imagery is really easy, as CIRA/NOAA have done a superb job making so many versions of the imagery available in handy animated GIFs, HTML5 loops, and of course directories full of images.
There doesn't appear to be an official API for the processed images, but the filenames are very canonical and easy to work with. I downloaded about 1,500 "full-disc" GeoColor images via curl with a simple shell script. I did have to write a little code to generate the filenames based on the timestamps. There's a photo every 10 minutes on the hour:
20222651520_GOES16-ABI-FD-GEOCOLOR-10848x10848.jpg
So breaking this filename down:
- 2022 (year)
- 265 (the 256th day – Sept. 22)
- 1520 (the time, so 3:20pm)
- GOES16 - The satellite
- ABI - The camera / imager
- FD - Full disc
- GEOCOLOR - The 'product' or channel
- 10848x10848 - The image dimensions
Of course if you want to cut out the middleman, and get the images directly from the satellite itself, you CAN do this with software-defined radio! Here's a good tutorial over at RTL-SDR.
Thanks for reading! 🌎🛰🌏
You can subscribe to our newsletter to get future posts delivered to your inbox for free. 👉🏻 📫 Subscribe now.
Sharing is caring
📣 If you think your followers or friends may like it, please consider sharing it.
🙋🏻♀️ If you have any suggestions, comments or requests, please email them to beautifulpublicdata@gmail.com
Thanks for reading!
- Jon Keegan (@jonkeegan)